Dow Theory
by www.surefire-trading.com
Ty Young
To Download This Report - Right Click Here
Anyone who’s ever purchased a DVD knows the difference between a “wide screen” production and a “full screen” production. To elaborate; when a movie is viewed on the television which is modified to fully fit your screen, it looks something like this:

|
|
When viewed at the theater, we see more of a panoramic view, such as this:
In more visual terms, we have the difference between this:

And this:

Hi, this is Ty Young with Surefire-Trading.com and today I will be discussing the basic principle behind the Dow Theory. Not unlike the examples given above,
In A Nut Shell
…..the Dow Theory is a line of thought that takes us outside the proverbial “box” – or outside mainstream economics; a school of thought which has come to be used for developing the heart and soul of technical analysis. Over-simplified, his principle best describes the markets in this way:
The market has three movements….
- The main movement”, which is better described as the major trend.
- The “medium swing”, where the market reverses its direction for a short period of time, which many have come to recognize as Fibonacci retracements.
- And the “short swing” , which are contrived of minor fluxuations in the market.
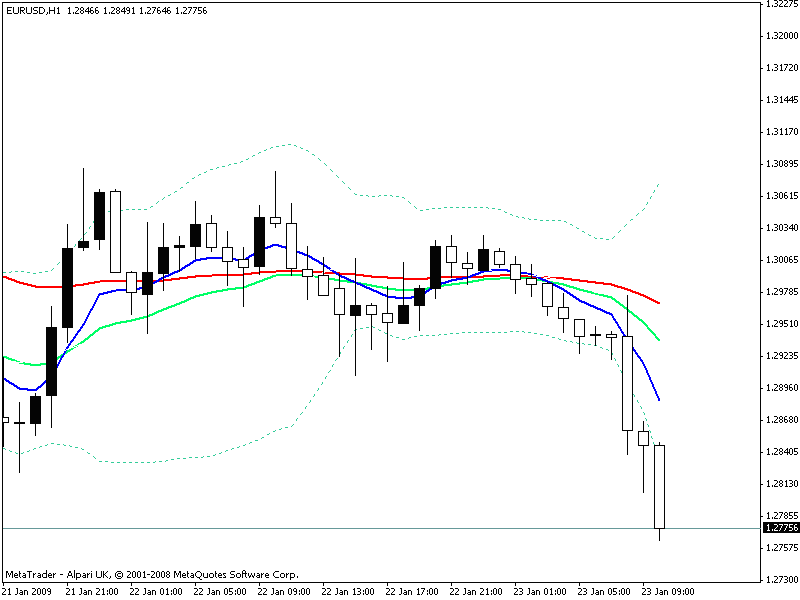
To This Perspective:
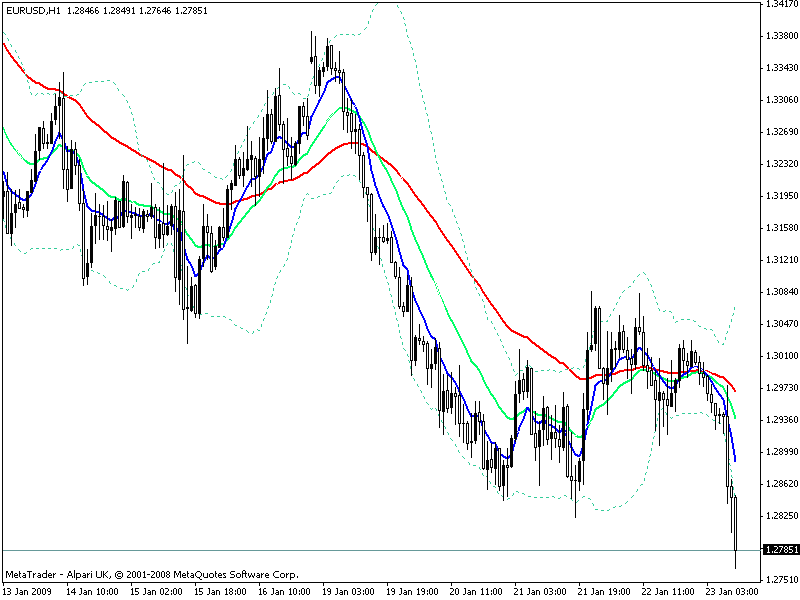
Both charts are 60-min. charts – but a broader view of the market is provided.
Now, what if we could display our charts in a way that would broaden our perspective in a far greater way?
Follow me here:
Let’s assume you are about to take a roadtrip from Paris, France to Rome, Italy. Initially, we wouldn’t pull out a map of Paris or of Rome, would we? In order to get our bearings, we would open an atlas such as this:

As we approach the border of Italy, we would open the atlas to a different perspective:

And as we approached Rome, we would look for an even more detailed perspective...

Ultimately, looking at something like this:

This is what Multiple-Time Frame trading is all about….
Giving us a “major” trend, a “medium” trend, and a “short” term trend perspective – providing us with an uncanny ability to profit from bullish and bearish swings.
Looking at some charts below, we have a………..
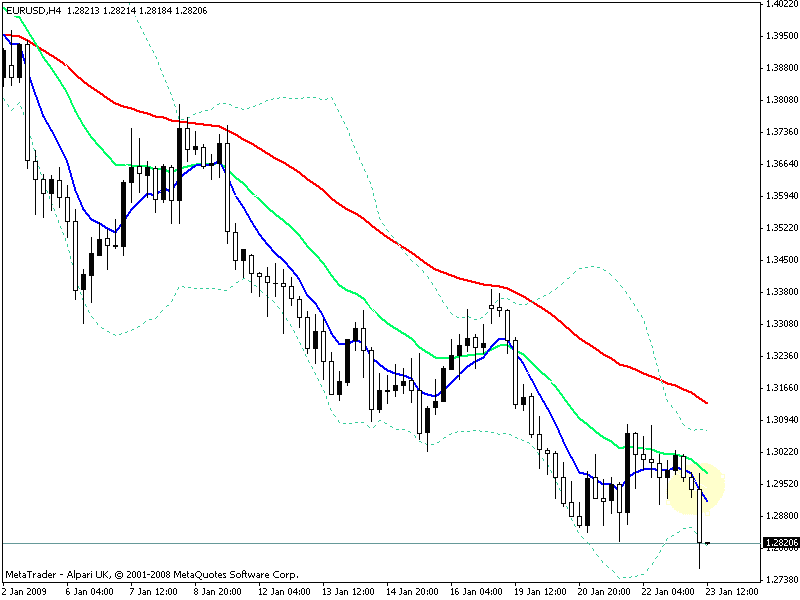
4-Hr. chart
(downtrend)
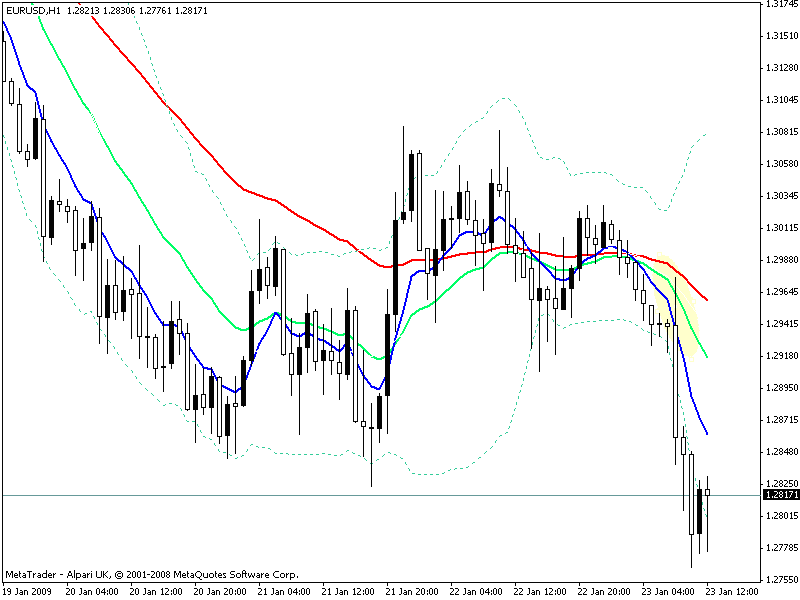
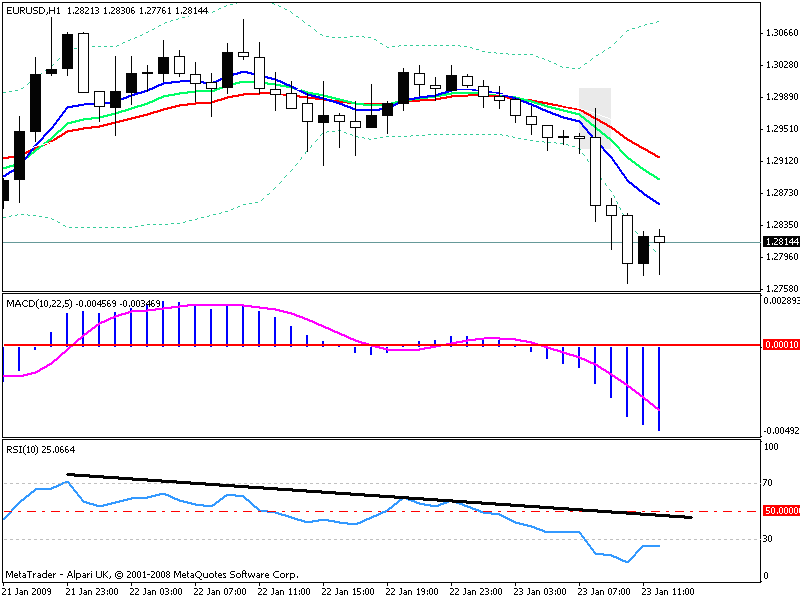
60-min. chart
(downtrend)
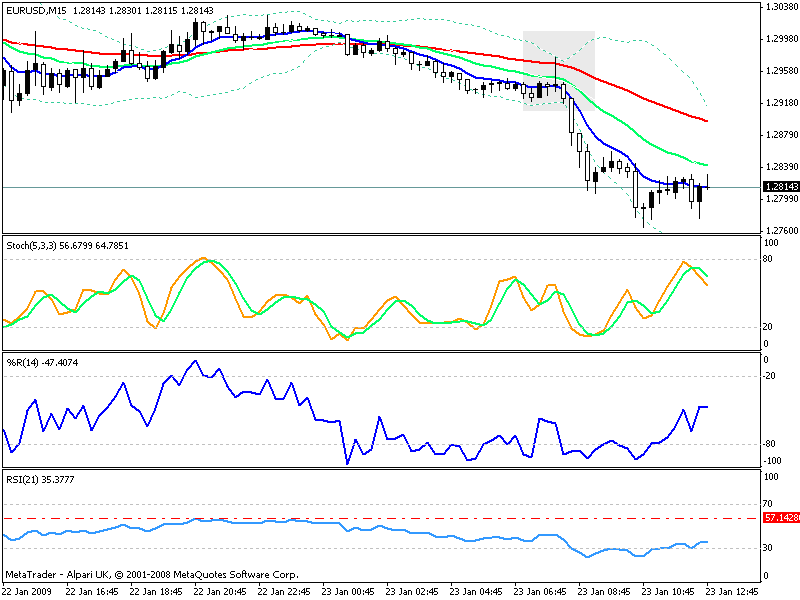
15-min. chart
(downtrend)
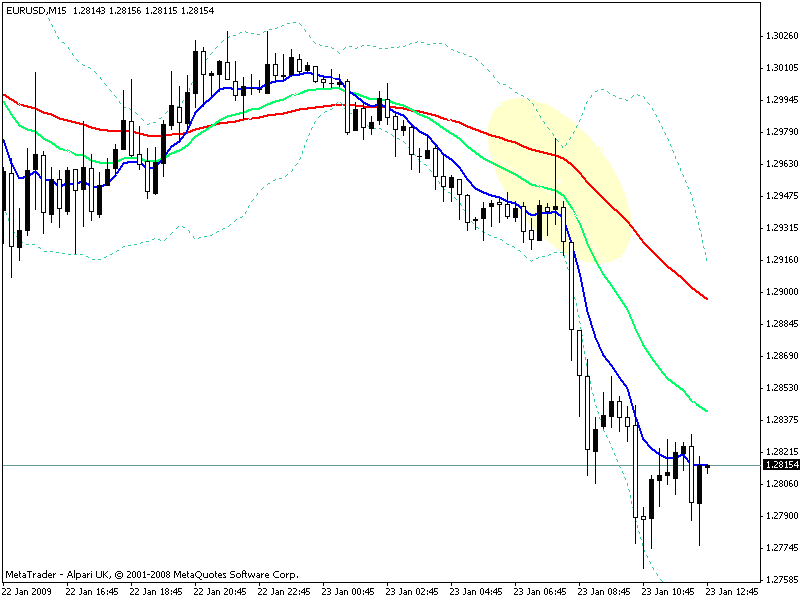
All three are in a “downtrend”….Oh my, I think I’ll be looking for a short order….what do you think? :o)
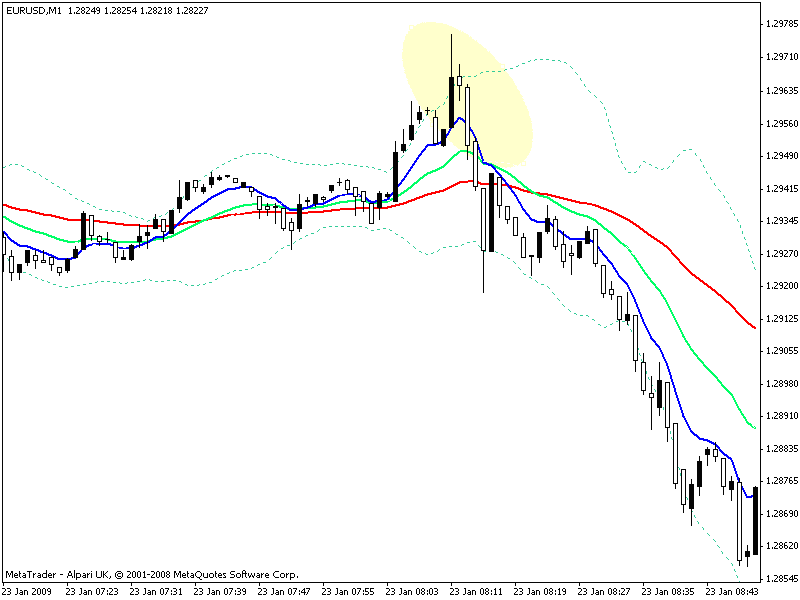
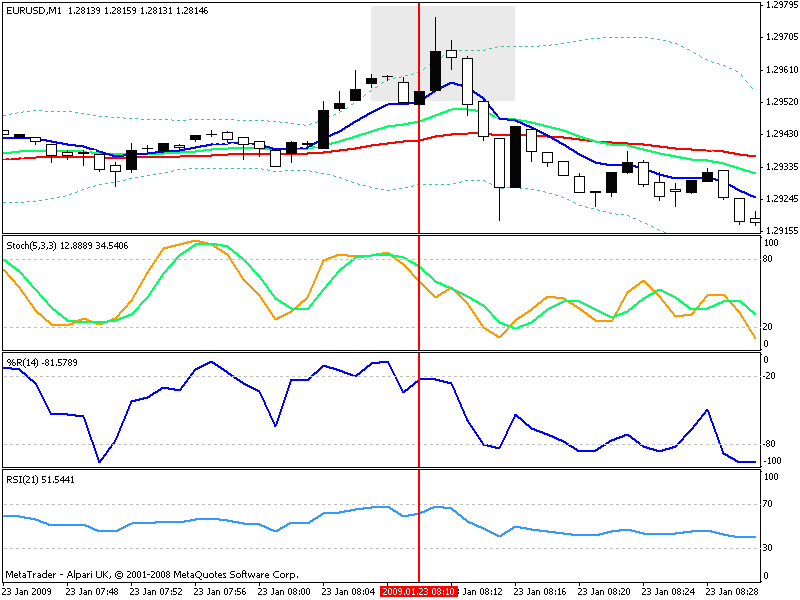
But since I’m a “day-trader”, let’s add the 1-min. chart as well…
Now let’s enlarge each one, and add some indicators.
Analysis:
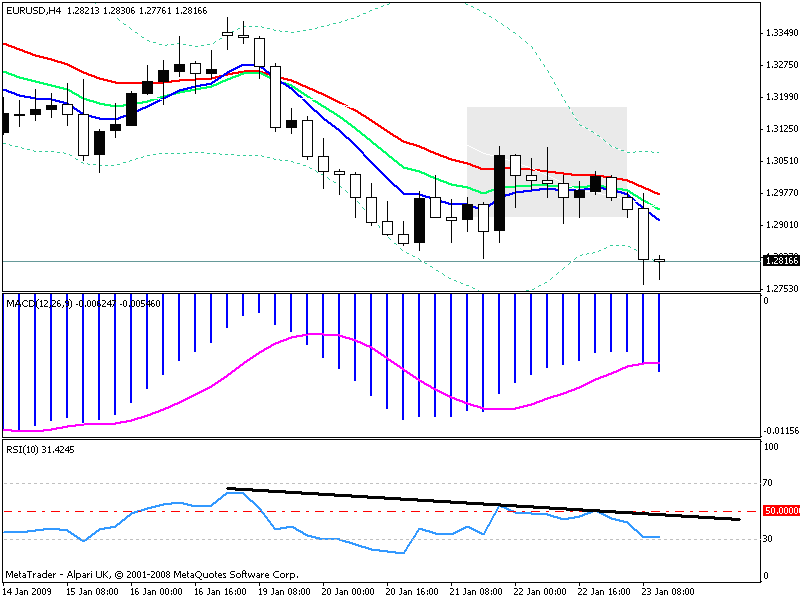
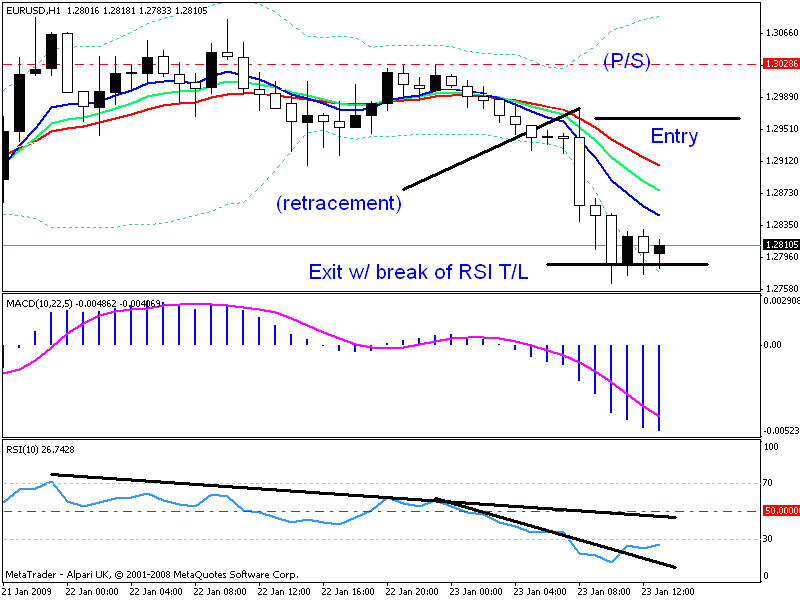
- 4-hr. chart: My EMAs (21,13,8) have been in a strong bearish sloping action, the MACD is below the zero line, and the RSI is not only below the 50 line, but it has remained below the RSI trendline (T/L). For some, watching the 4-hr. chart may have been sufficient for a short order, but since the Euro had been in a downfall for some time, it was important to me to see if the bears were weakening in their conviction…
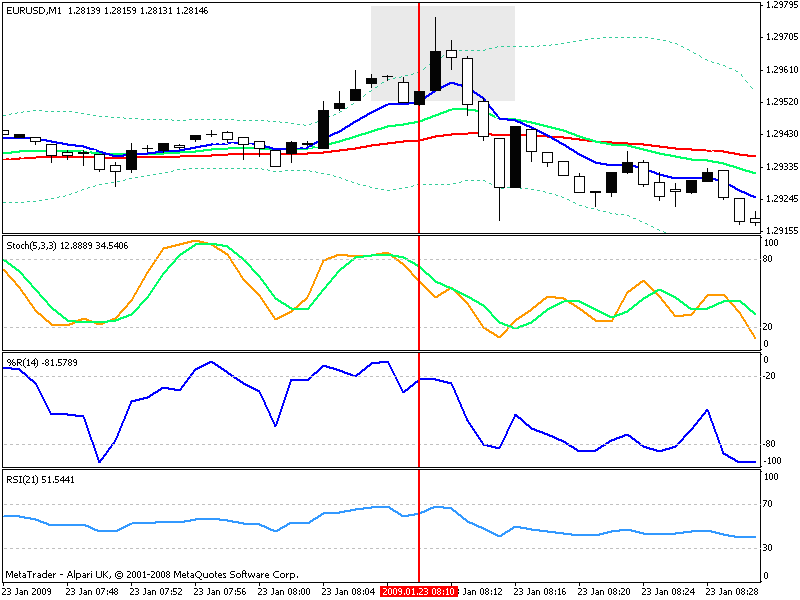
- The 1-min. EMAs are in a bullish slope, and each of the indicators is in overbought (O/B) territory.
- This strategy gained me about 200 pts. Had I not waited for the retracement, I would have profited 50 pts. less. Also, by waiting for the pullback, I shortened the distance between my entry and my protective stop (P/S) by 50 pts…decreasing my risk….pretty good, huh?
Take time to check out the video...
With Surefire-Trading.com, this is Ty Young. Reminding you to, “Read the charts”.
Good Trading!!! :o)
Ty Young
surefire-trading.com
| To Download This Report - Right Click Here If You need help with Acrobat Reader (PDF) Click HERE |
 |
|---|

